Description
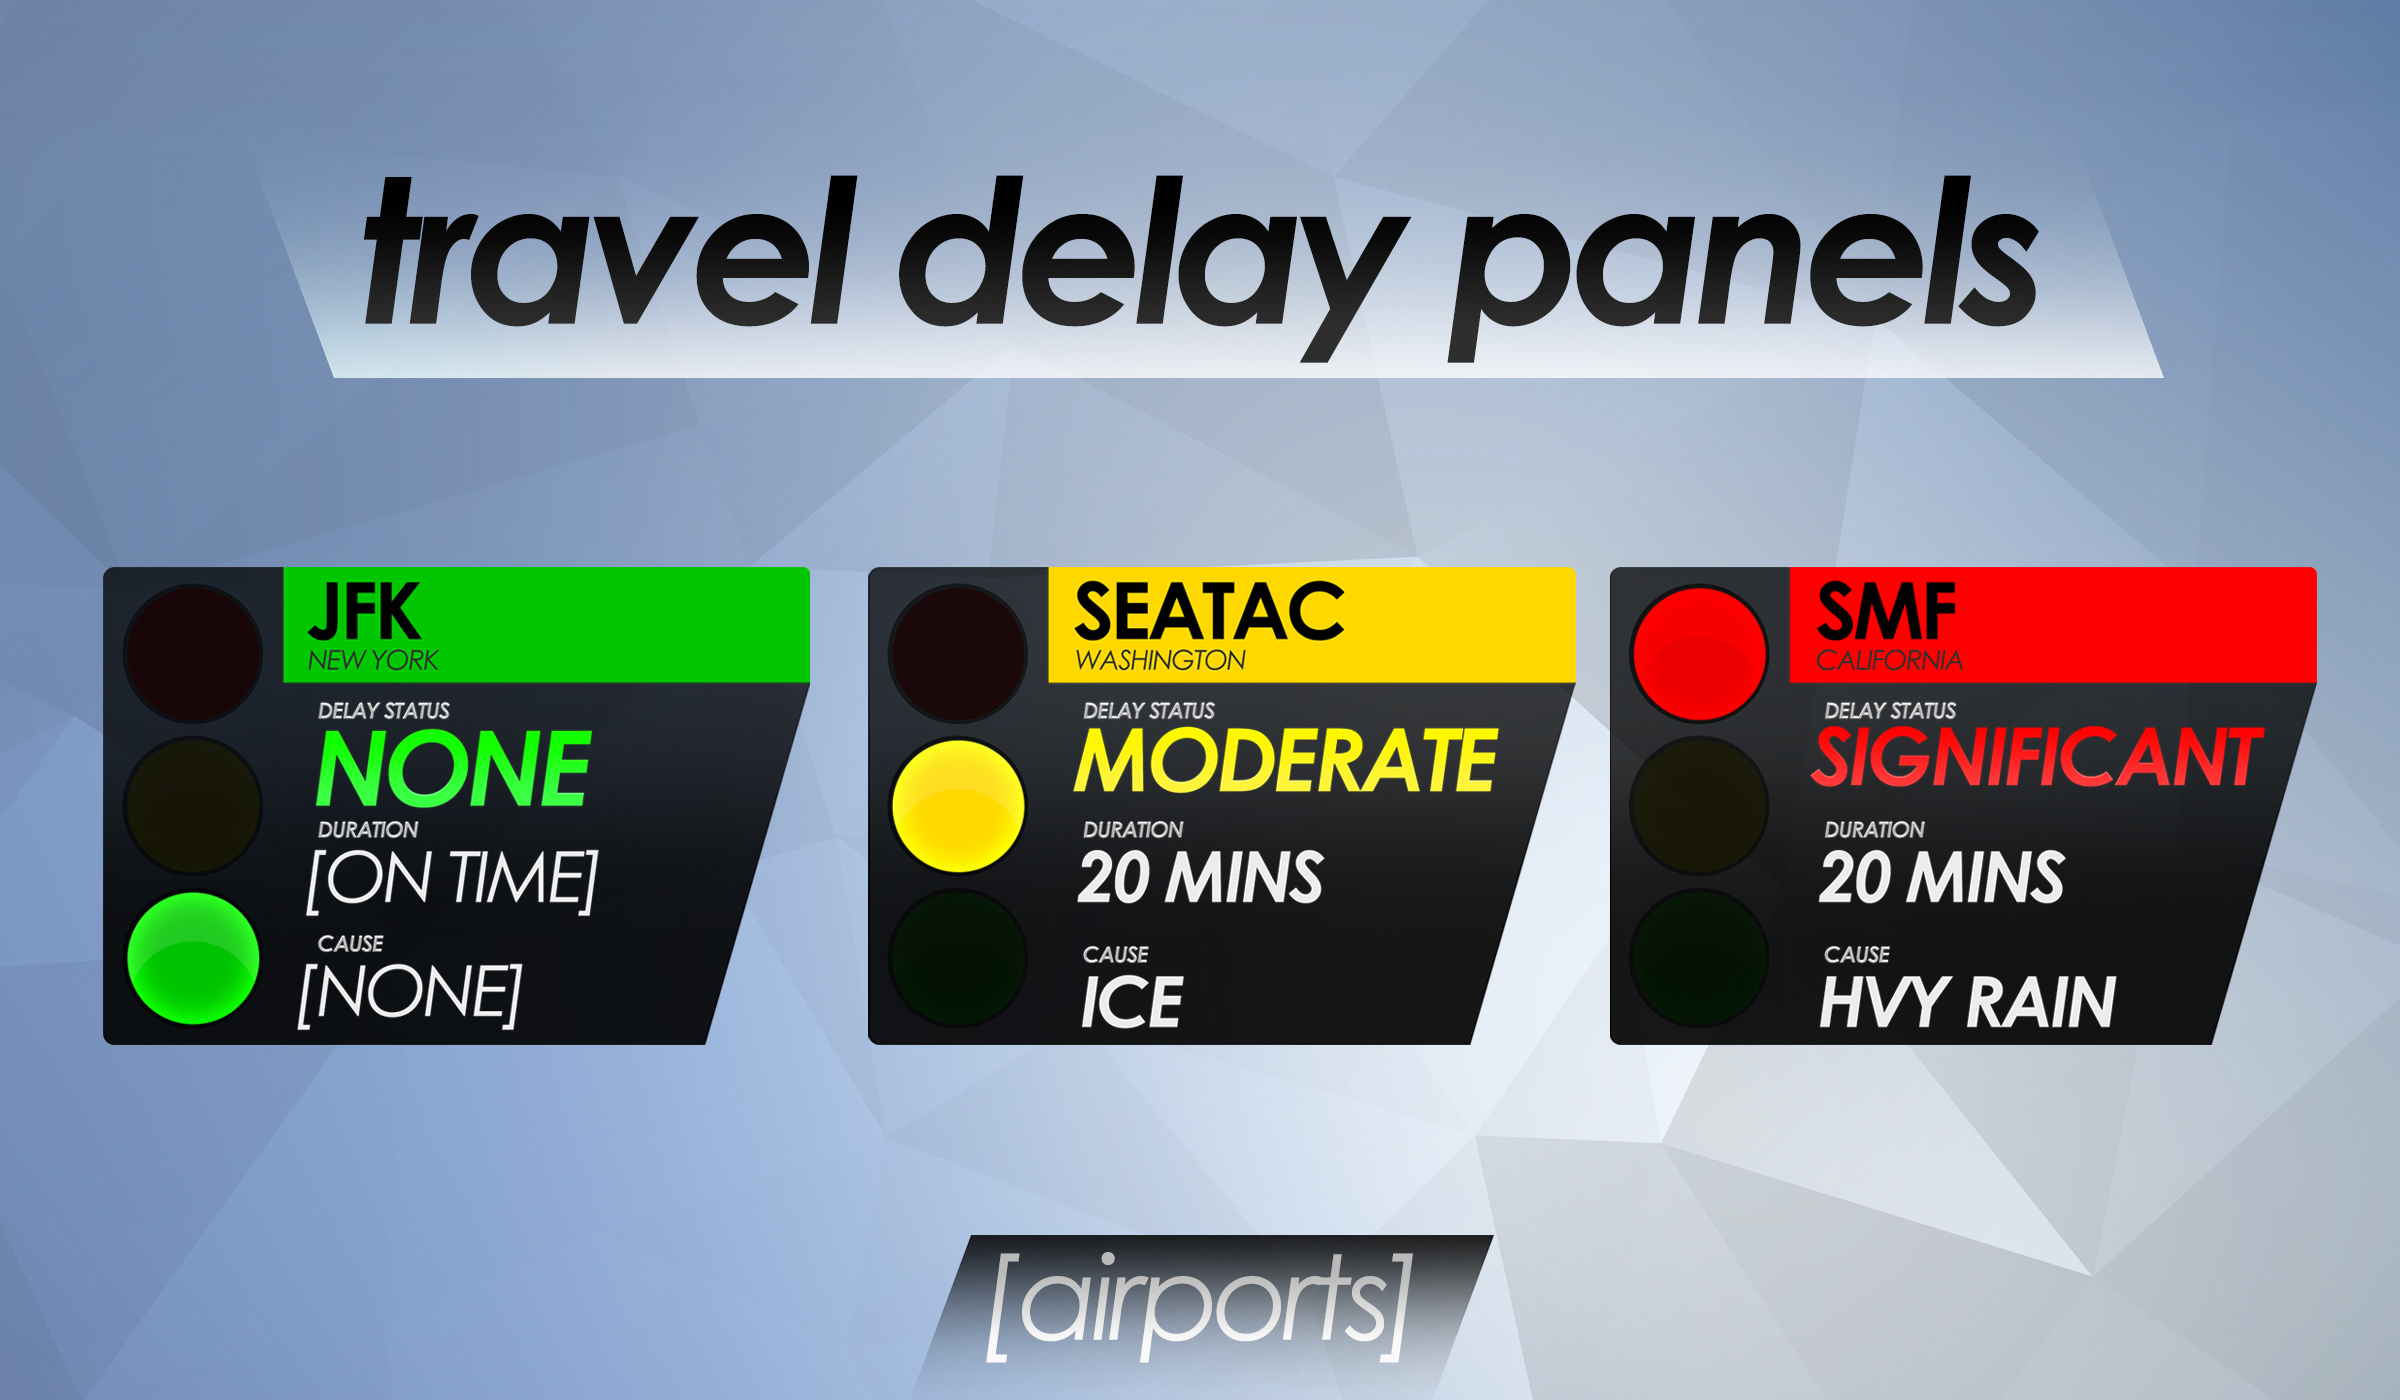
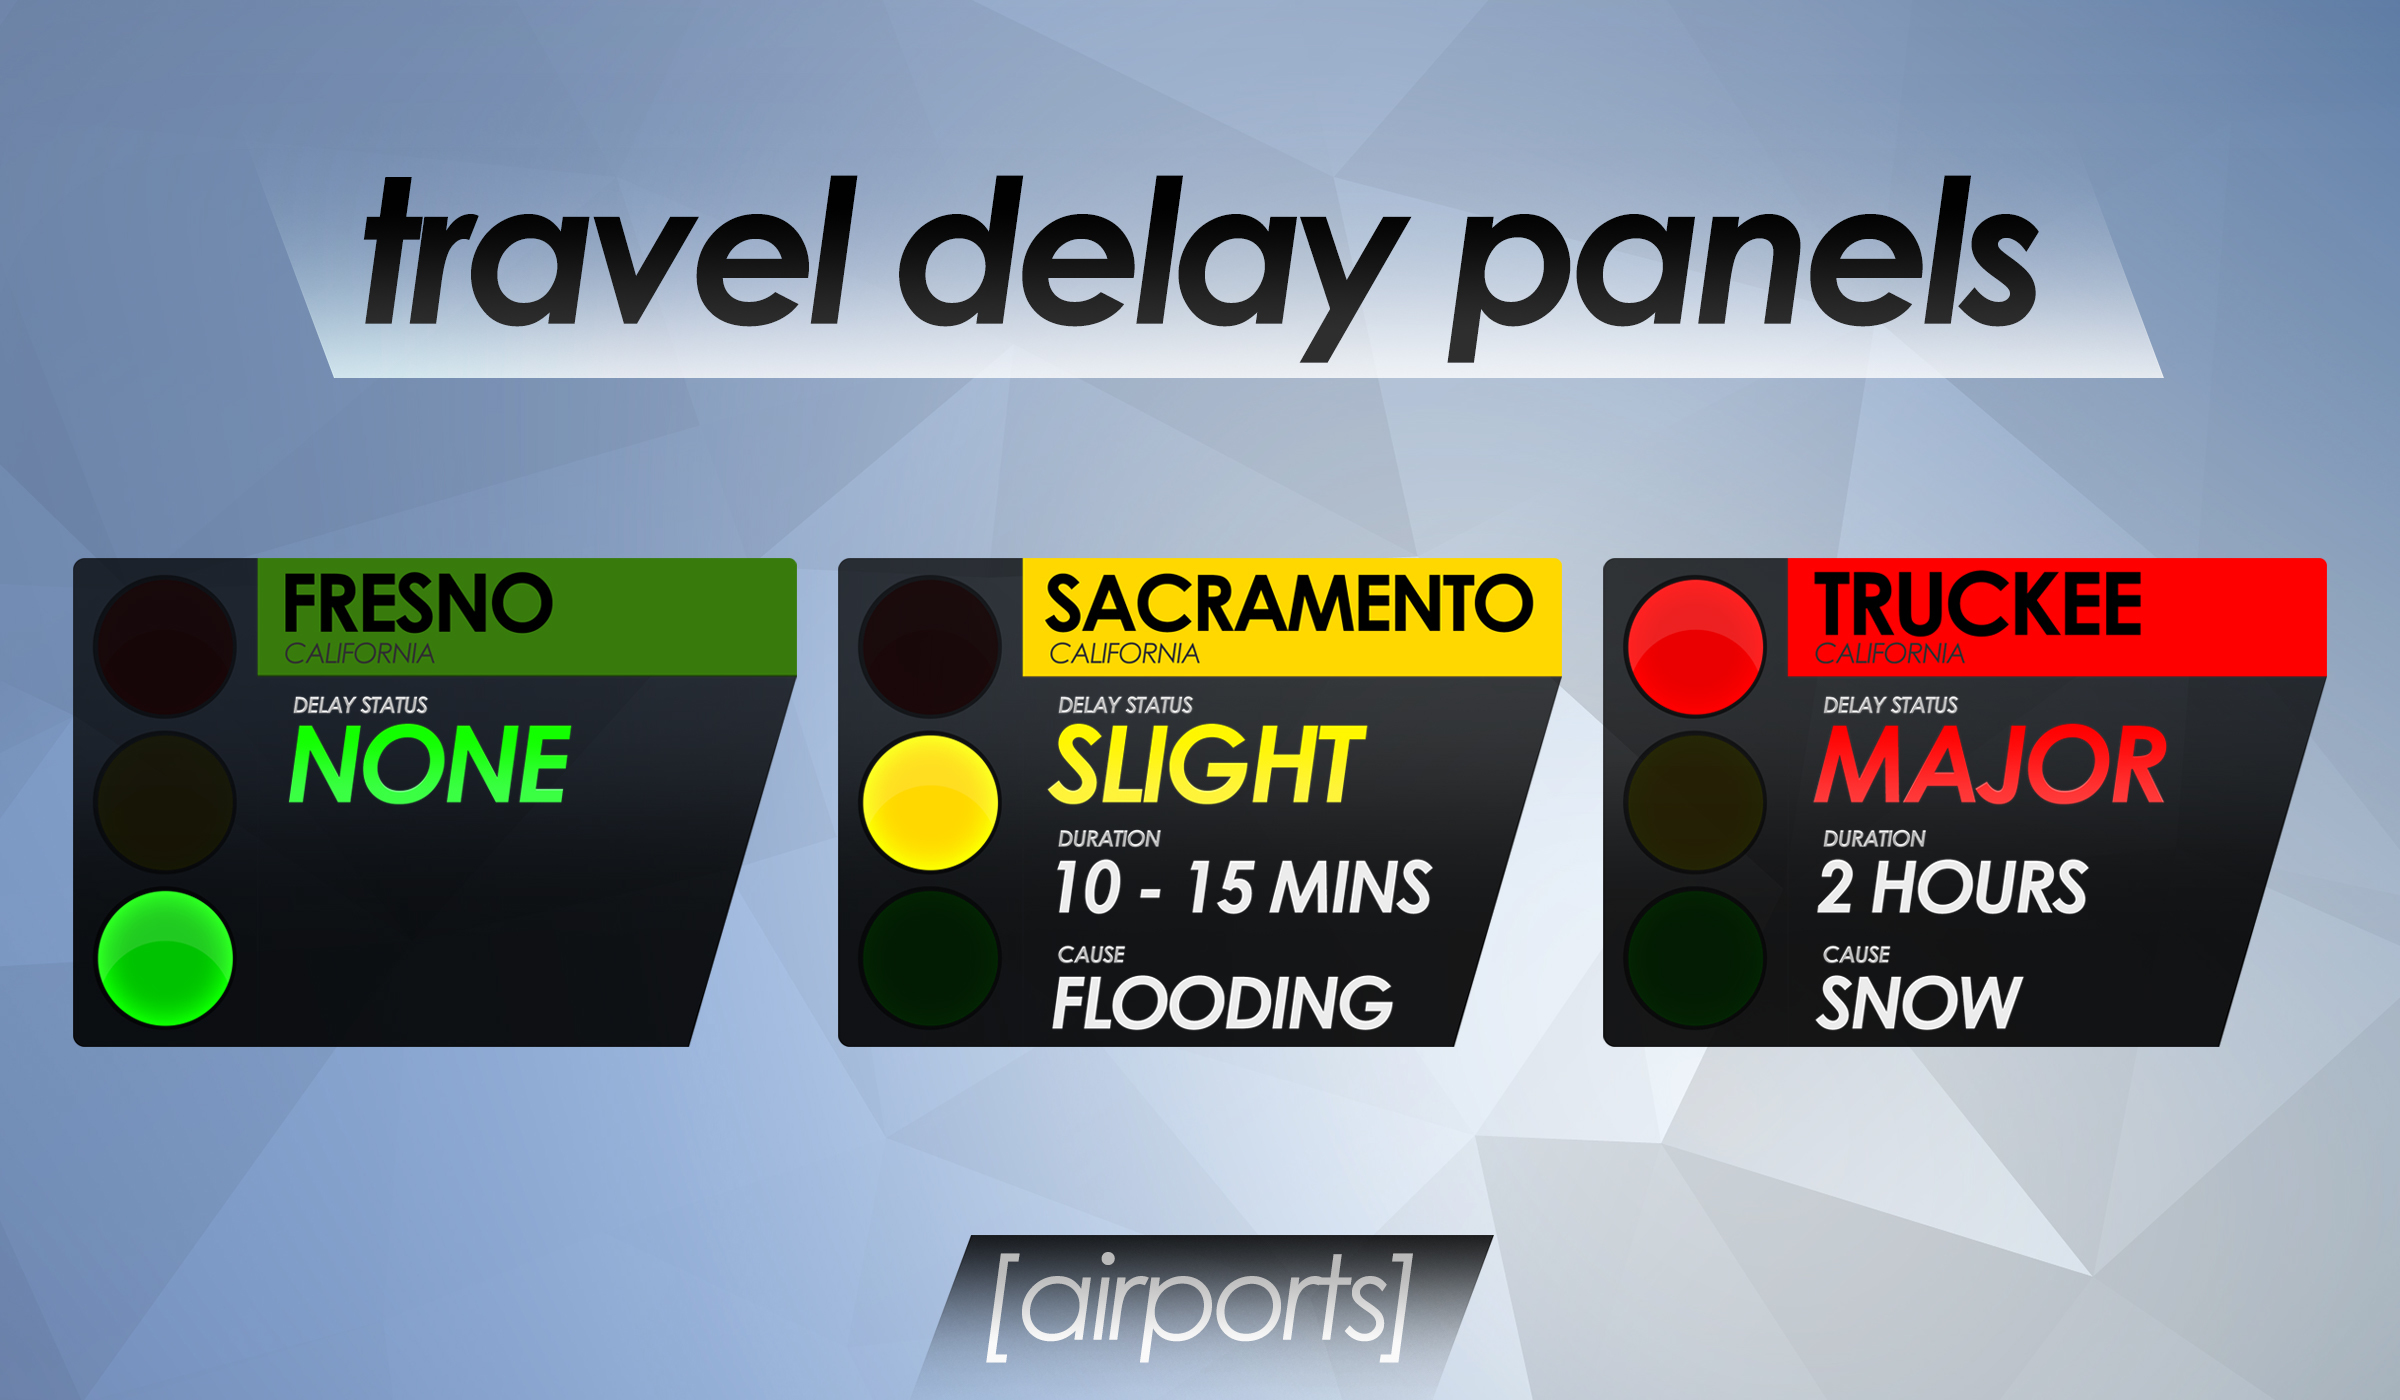
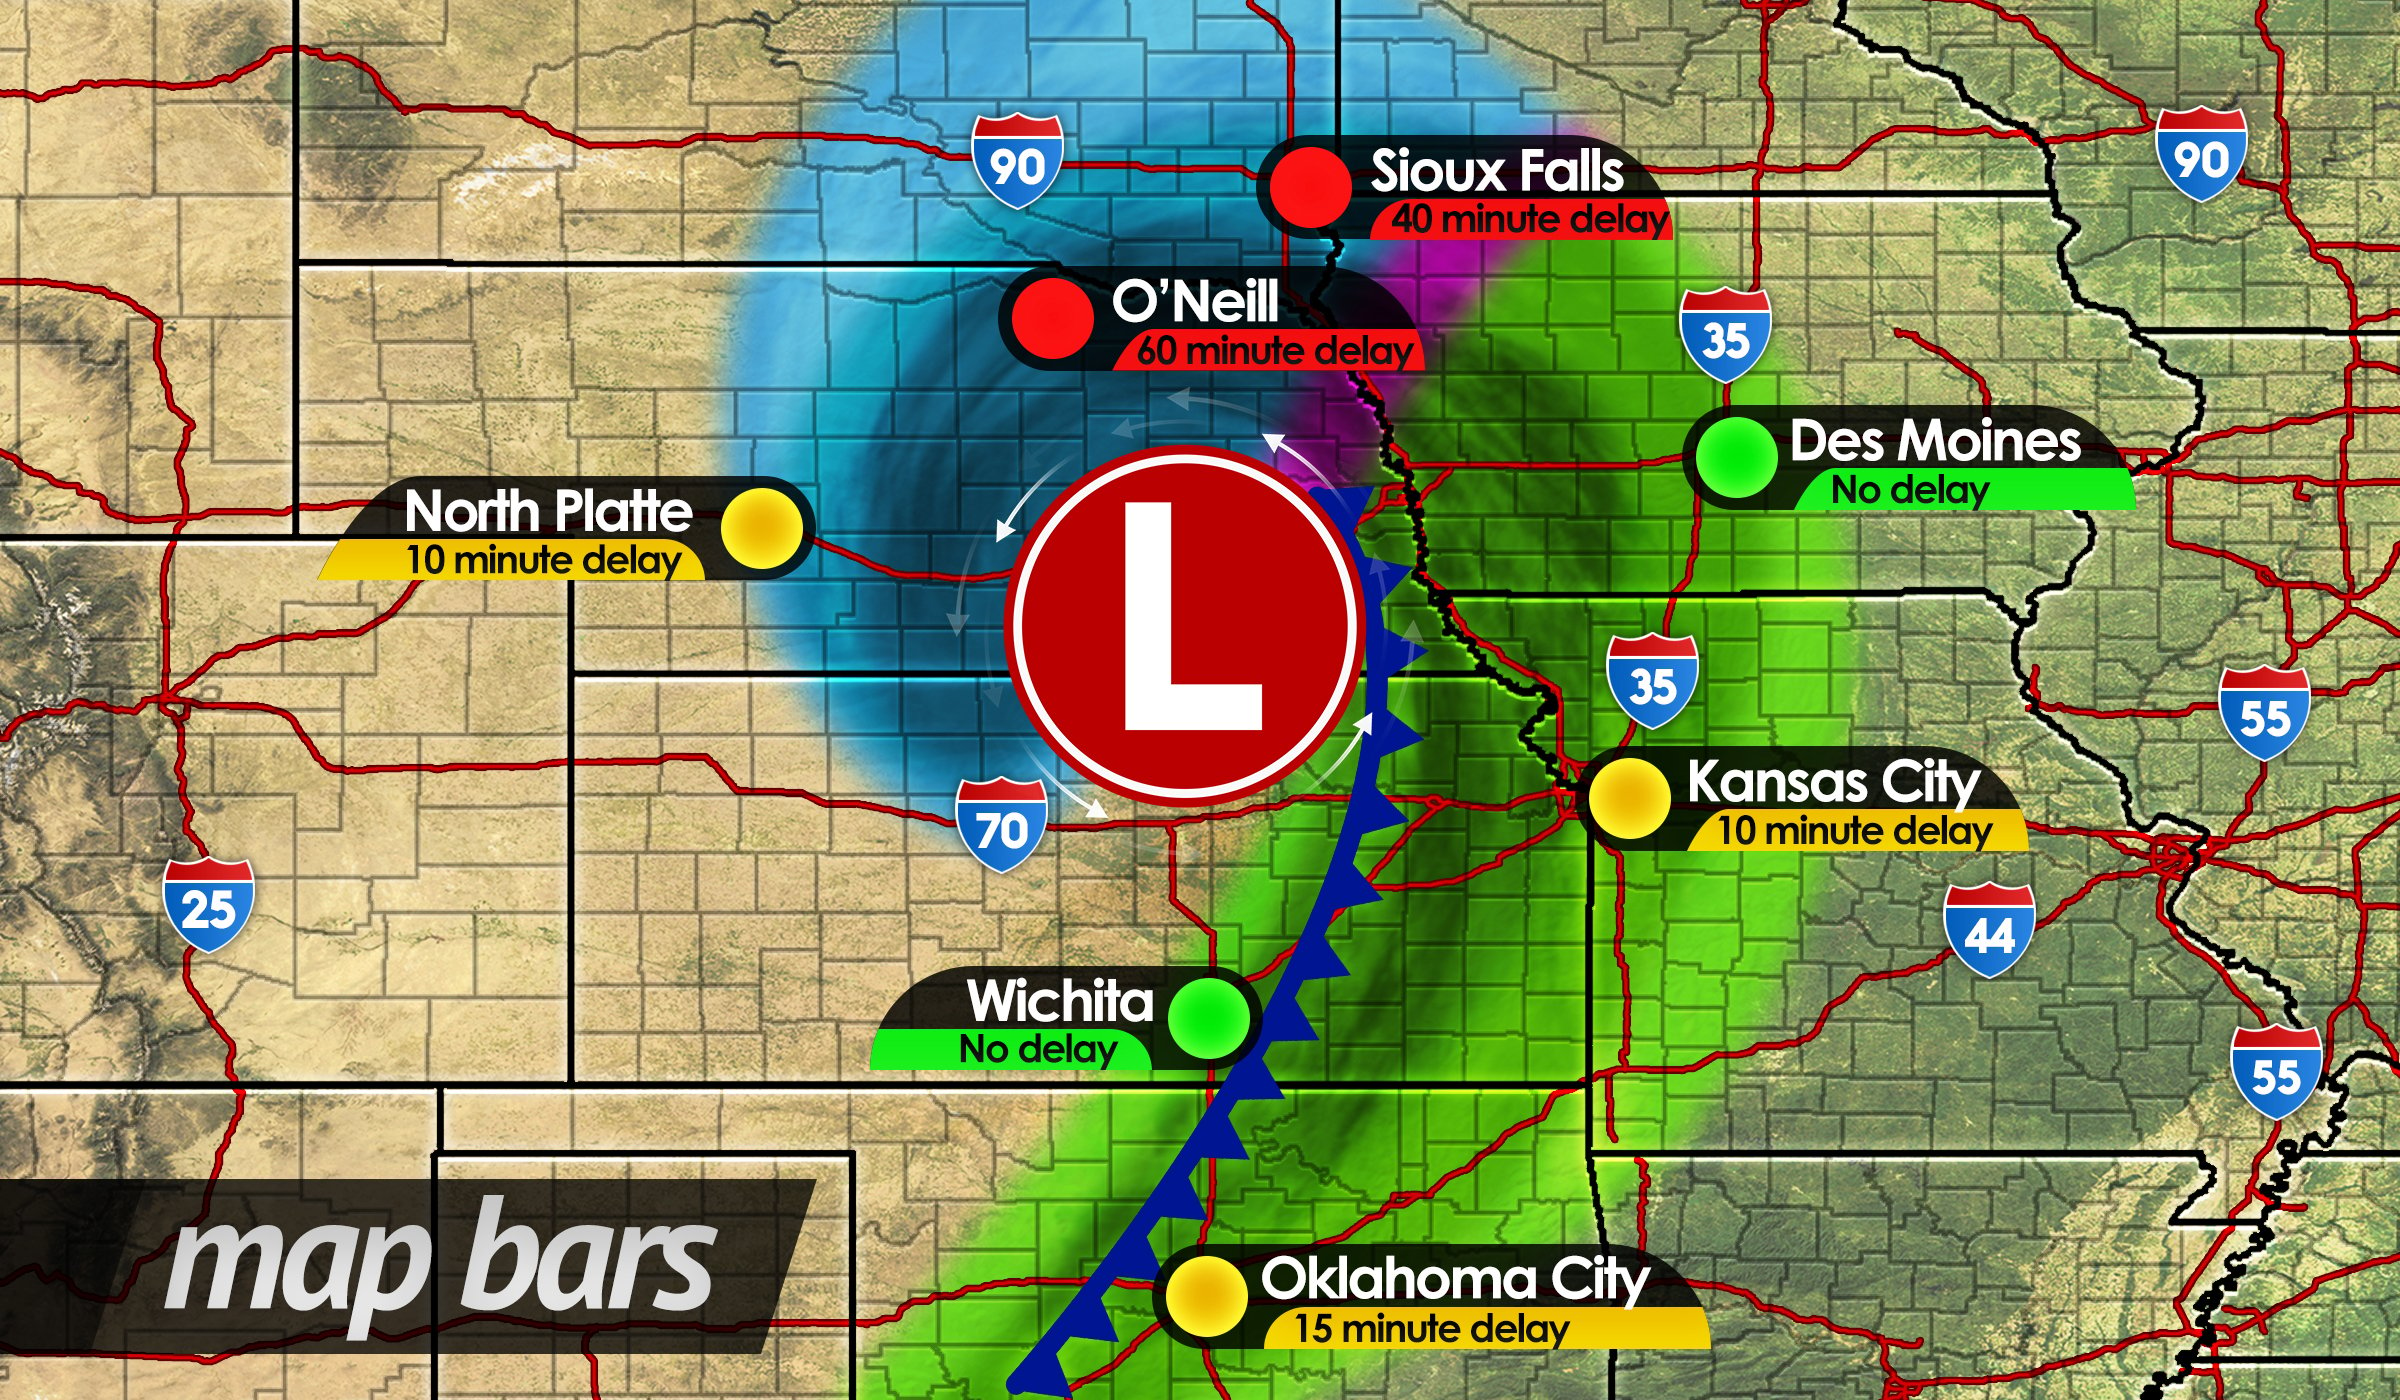
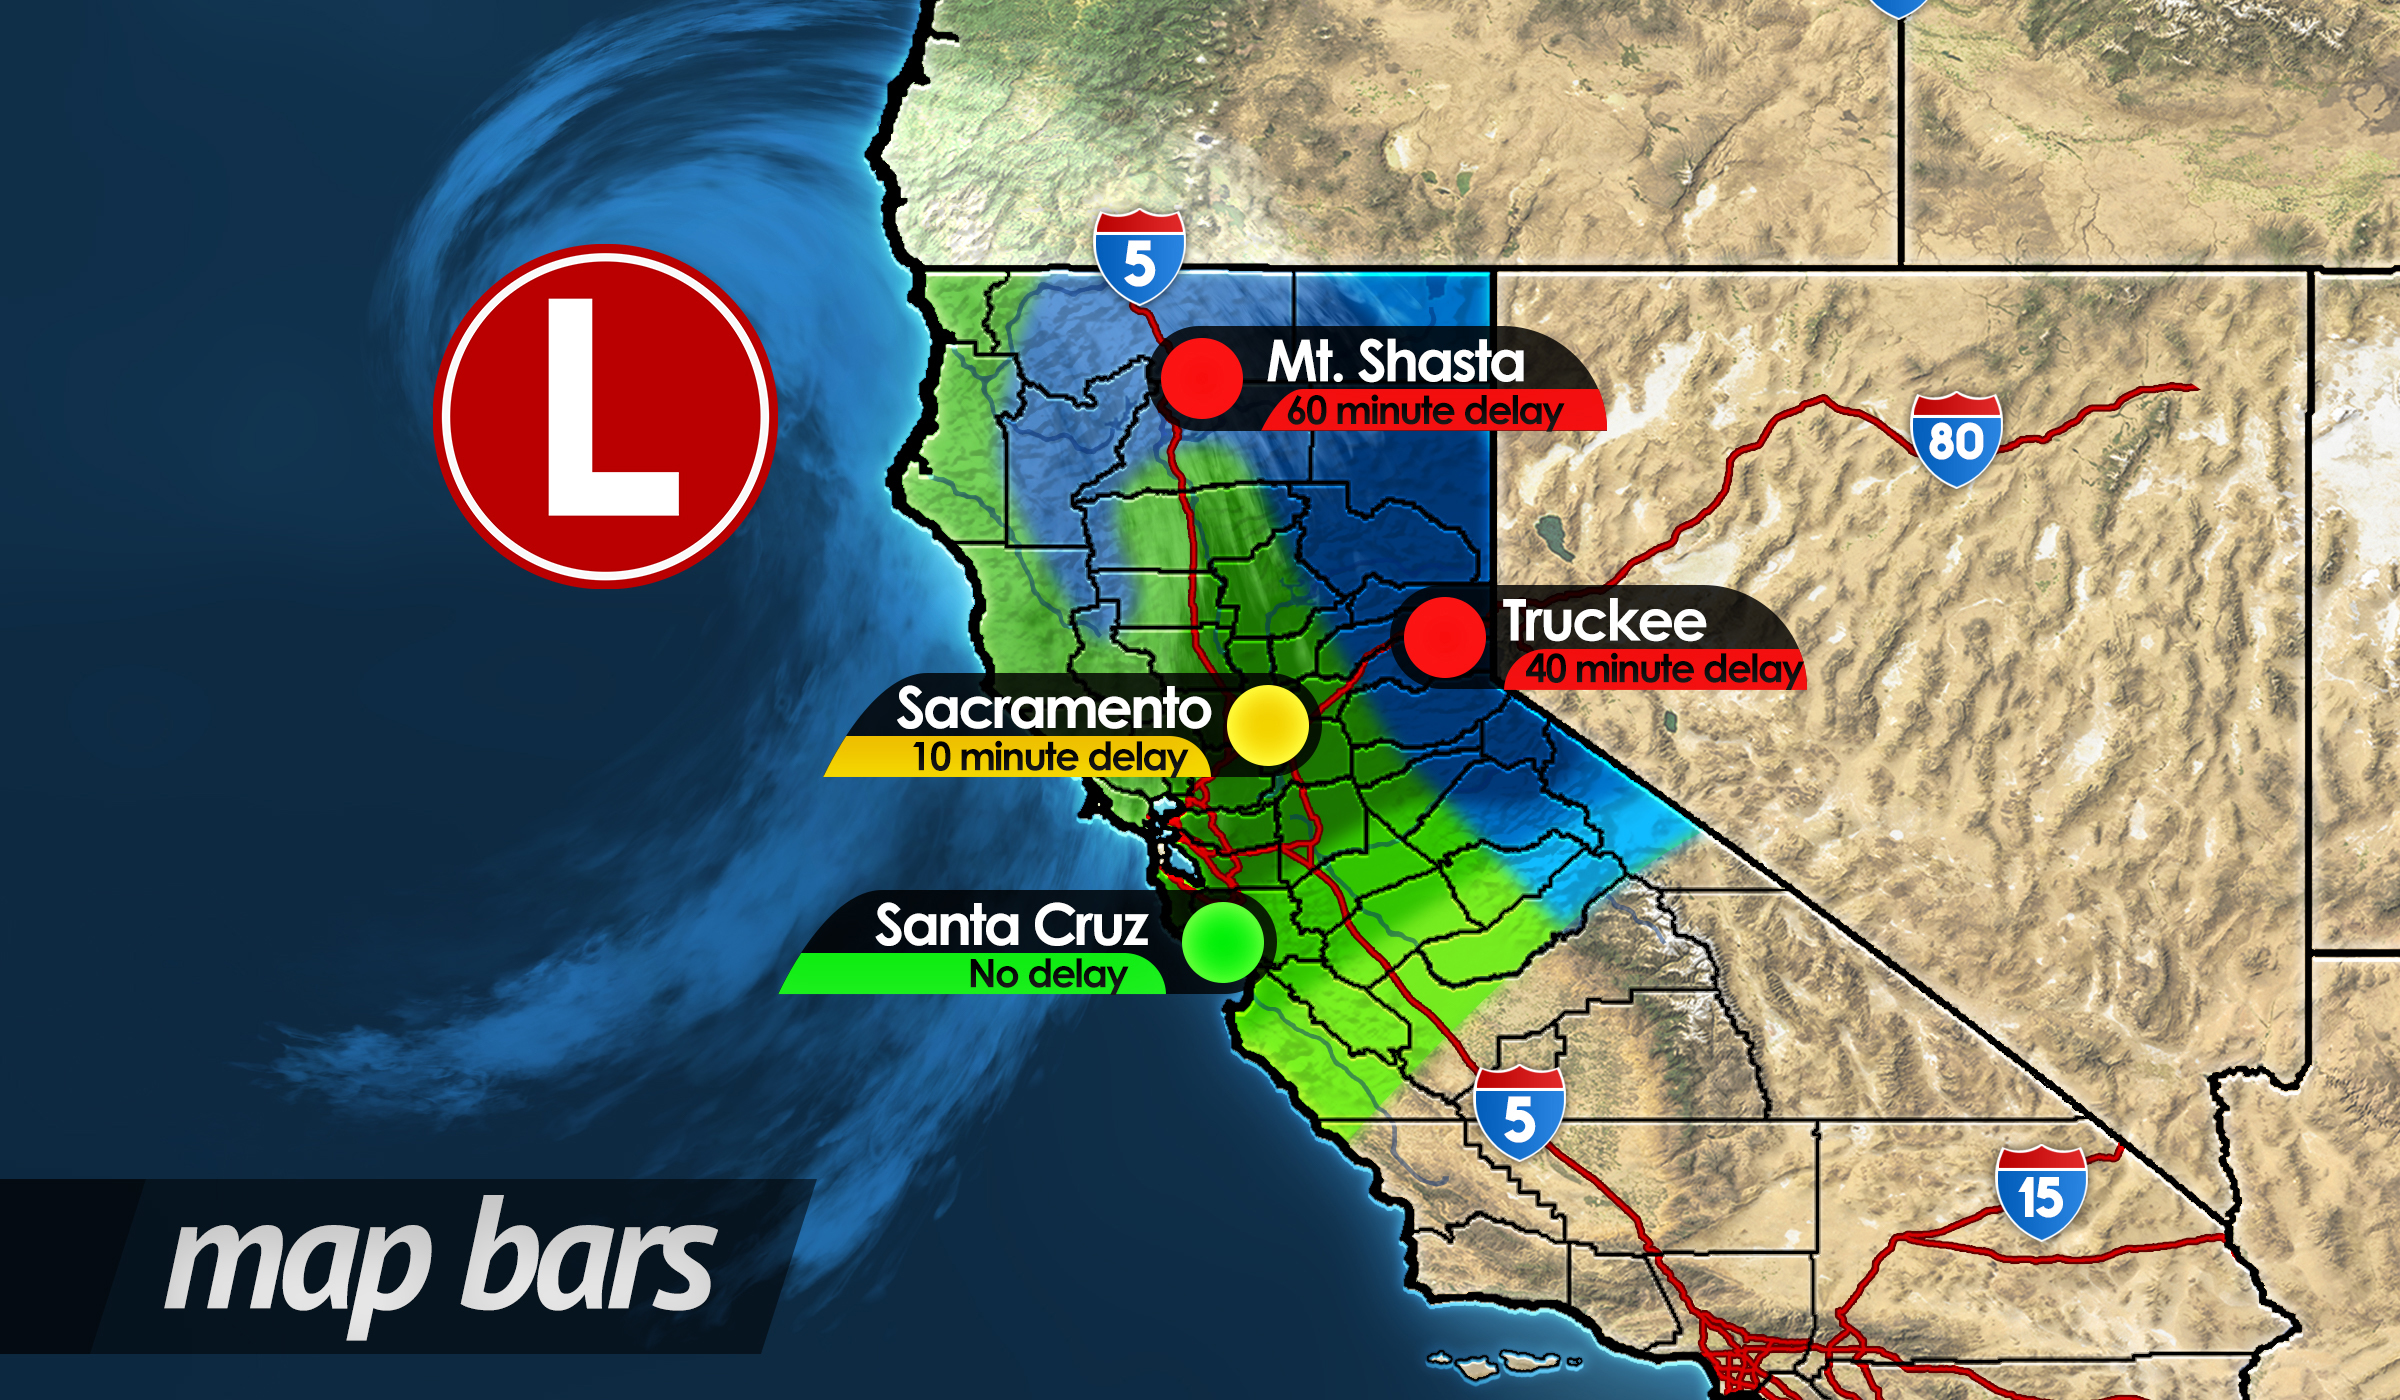
There’s a multitude of ways to try to display travel displays to the public, but the simple route is always a surefire route when it comes to displaying this data. With MetGraphics Travel Delay Data Displays (admittedly a tongue-twister of a product name), you get two simple but stylish design and display styles to utilize.On one hand of this product, you get panels with a 3-color light: green for minimal impact, yellow for low to moderate impact, and red for high to significant impact. These color stages can be selected and you just have to enter the rest of the information such as location/airport, duration of delay, and the cause of the delay.The other hand of Travel Delay Data Displays is a map bar; these bars also come in three color schemes which have the same meaning as stated above. These are excellent to utilize over a forecast map you’ve designed and can easily display specific locations with specific travel impact information.In the end, you’ll get:9 total impact display panels3 green – one that indicates “none” for delay duration, one that indicates “slight” delay duration, and one that is blank to enter your own information3 yellow – one that indicates “slight” delay duration, one that indicates “moderate” delay duration, and one that is blank to enter your own information3 red – one that indicates “major” delay duration, one that indicates “significant” delay duration, and one that is blank to enter your own informationBonus: the indicator lights by themselves, which is 3 – green, yellow, and red9 total impact map bars (3 different lengths for short – long city names & delay info)3 green – one long, one medium-length, and one short3 yellow – one long, one medium-length, and one short3 red – one long, one medium-length, and one shortThe panels come in 2330x1580px, and the bars come in 1900×490.Note: the map itself is not included with this product. If you are in need of maps, checkout MG Maps or the Ultimate Map Pack.




Reviews
There are no reviews yet.