Description
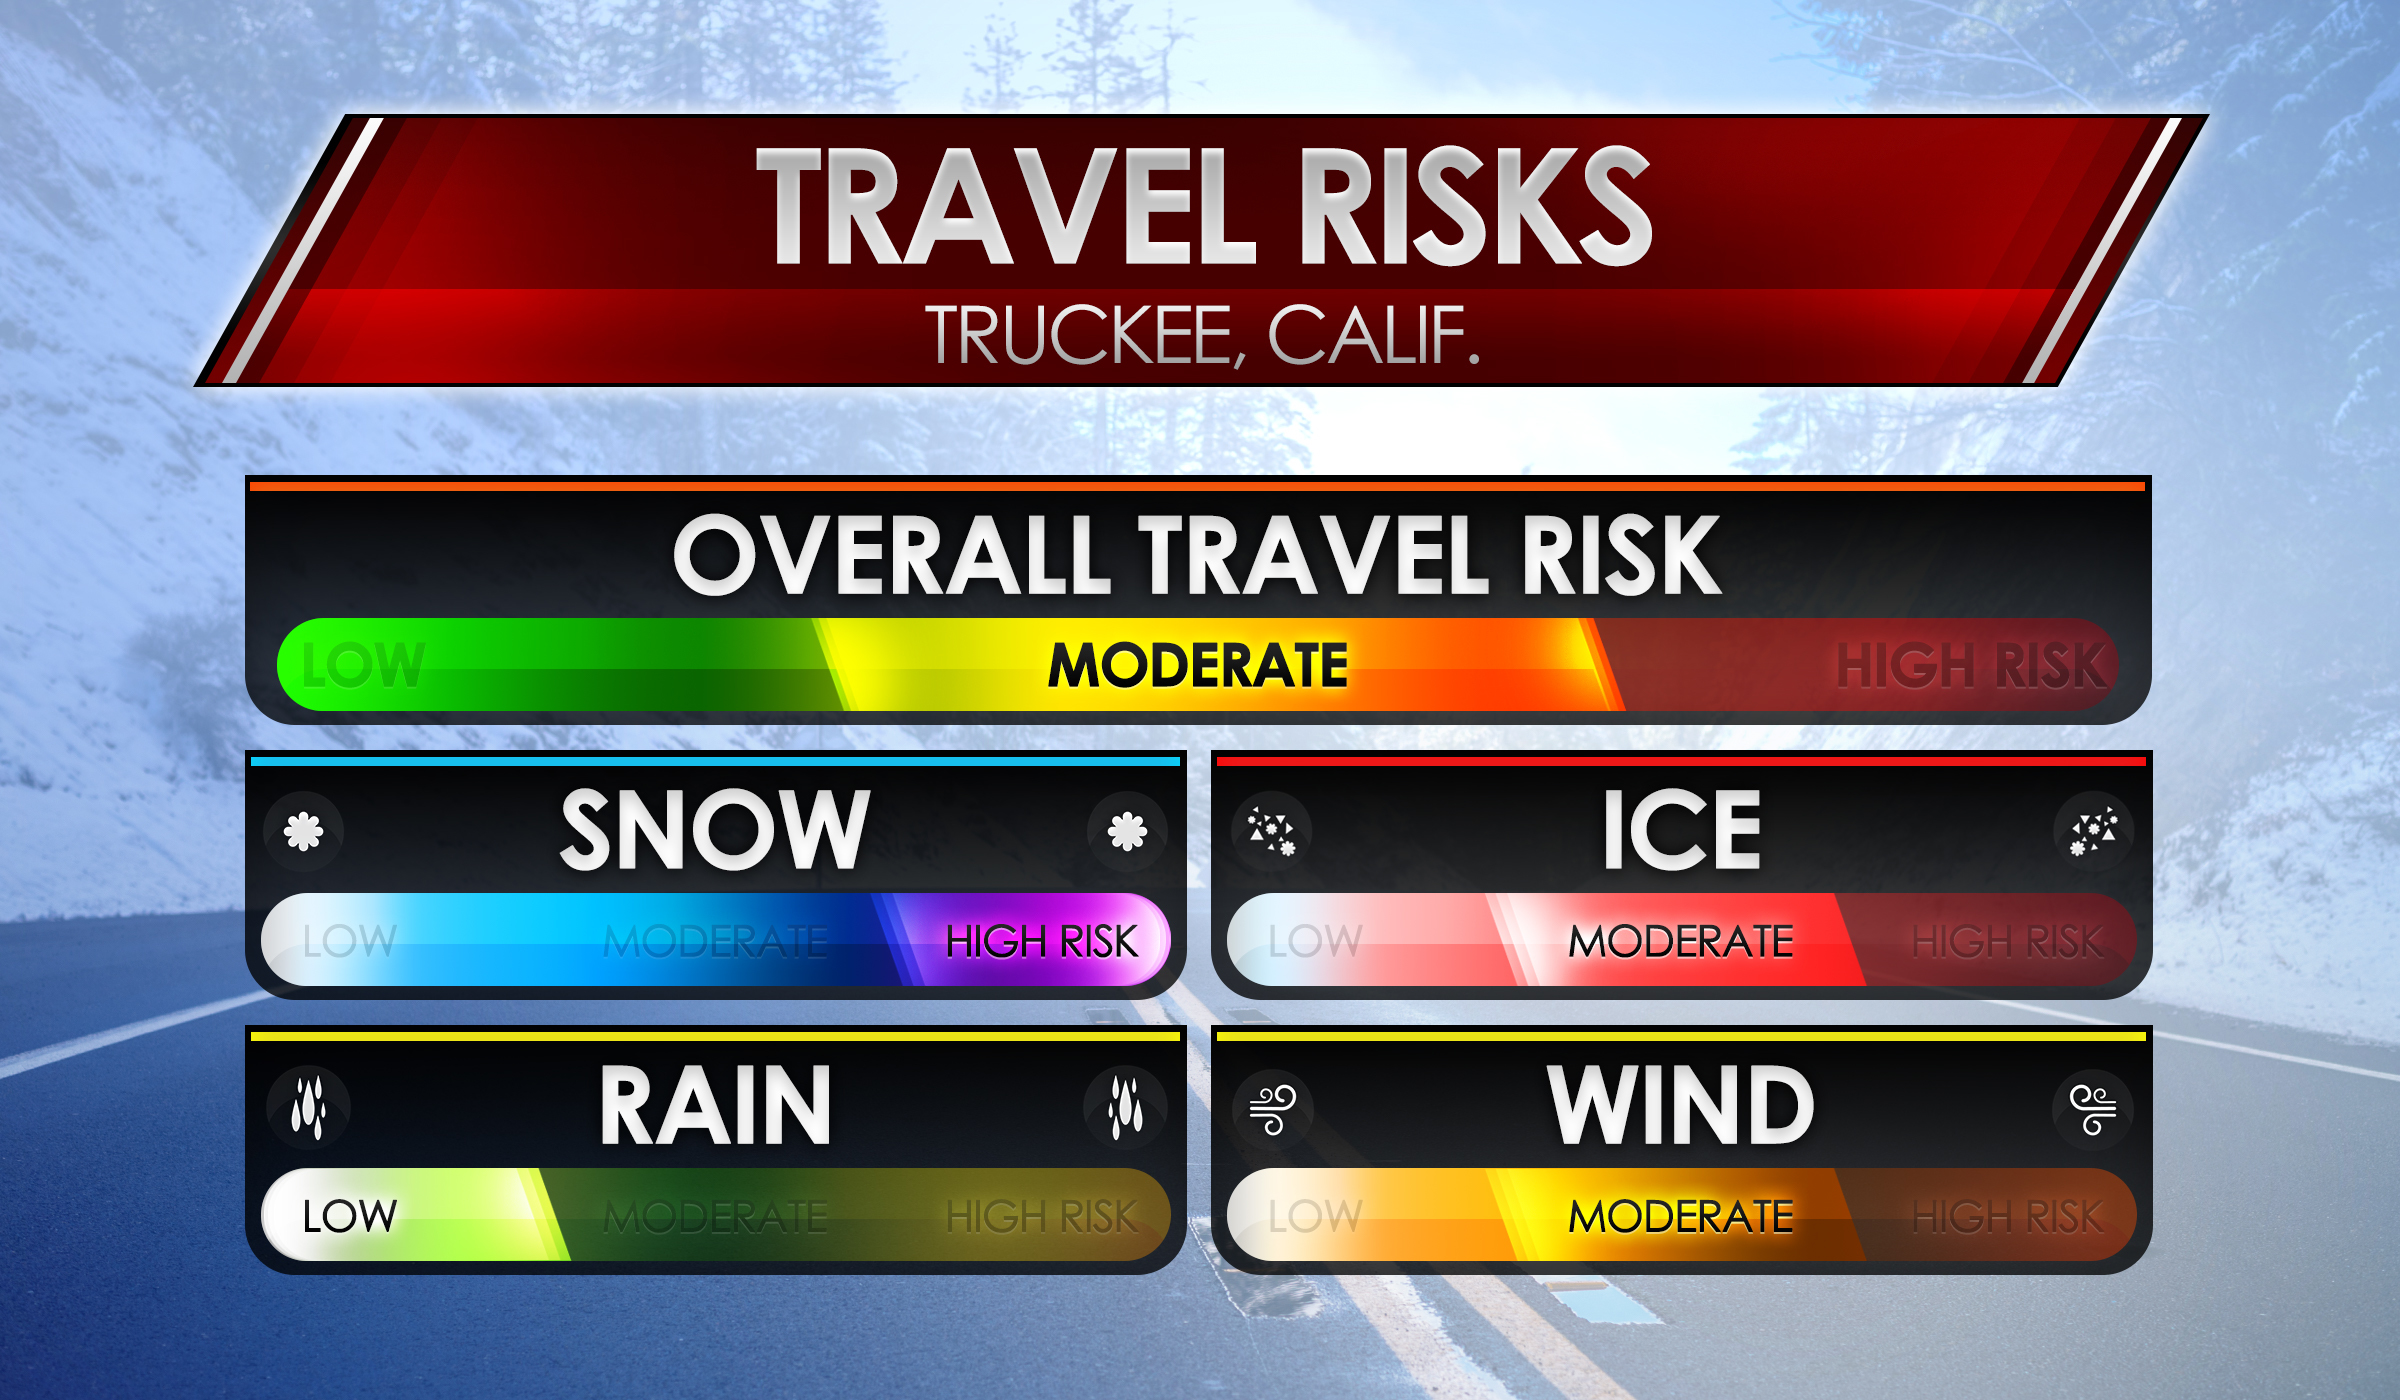
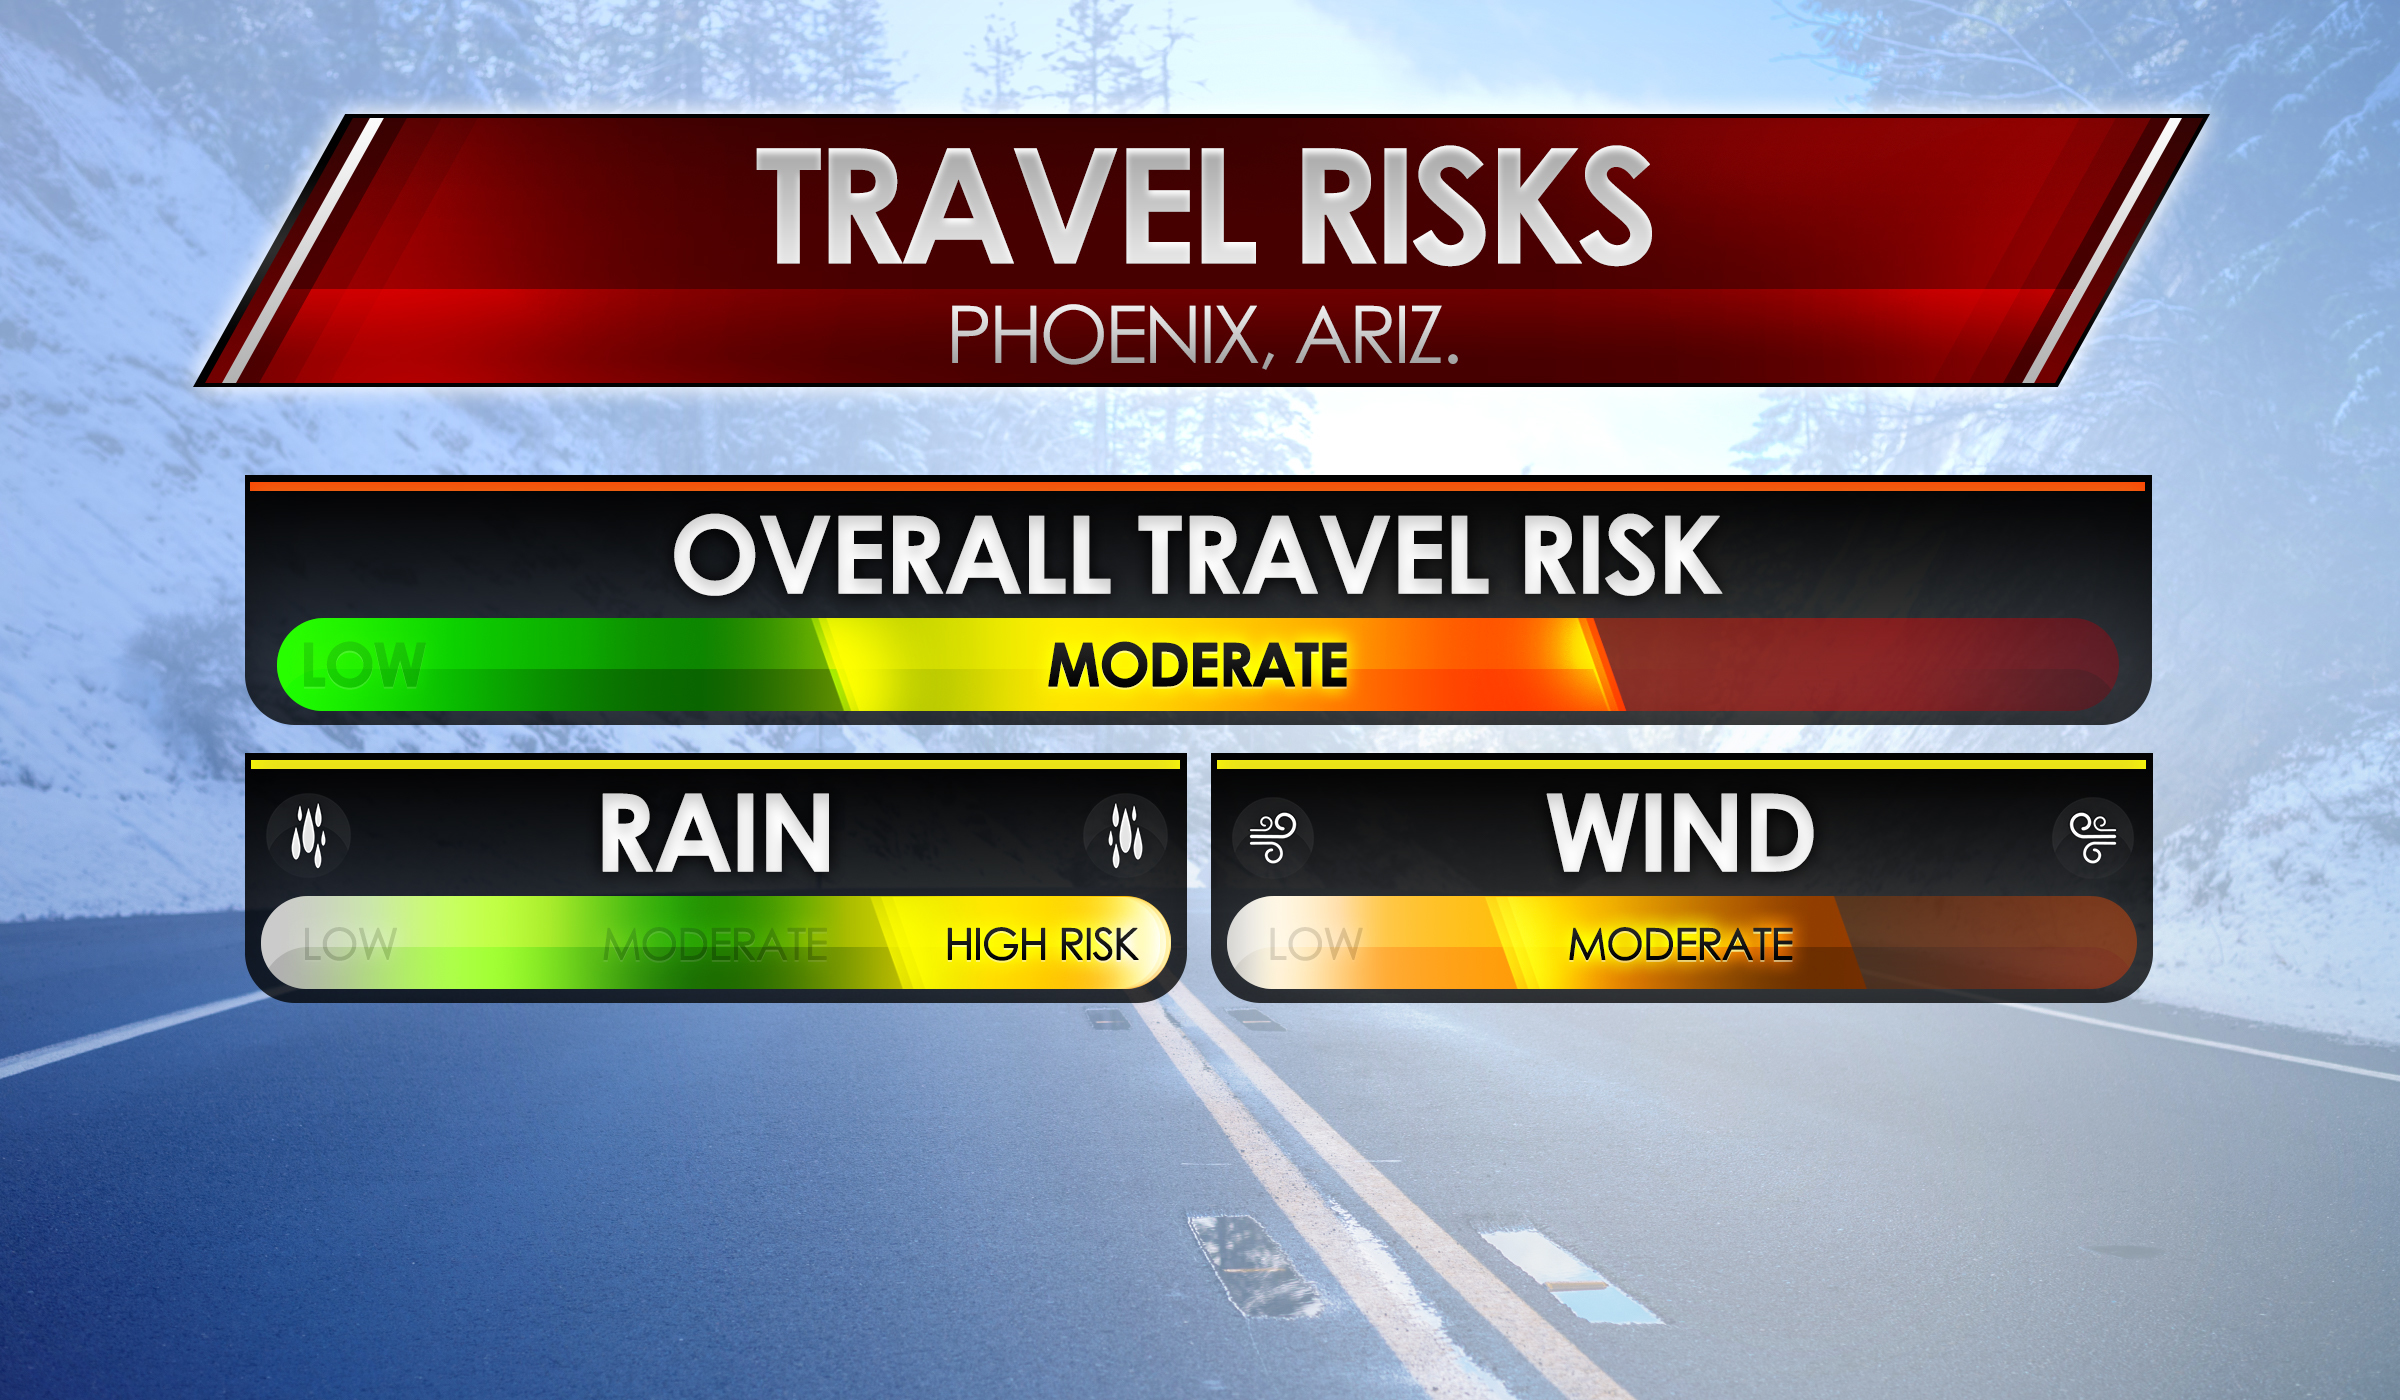
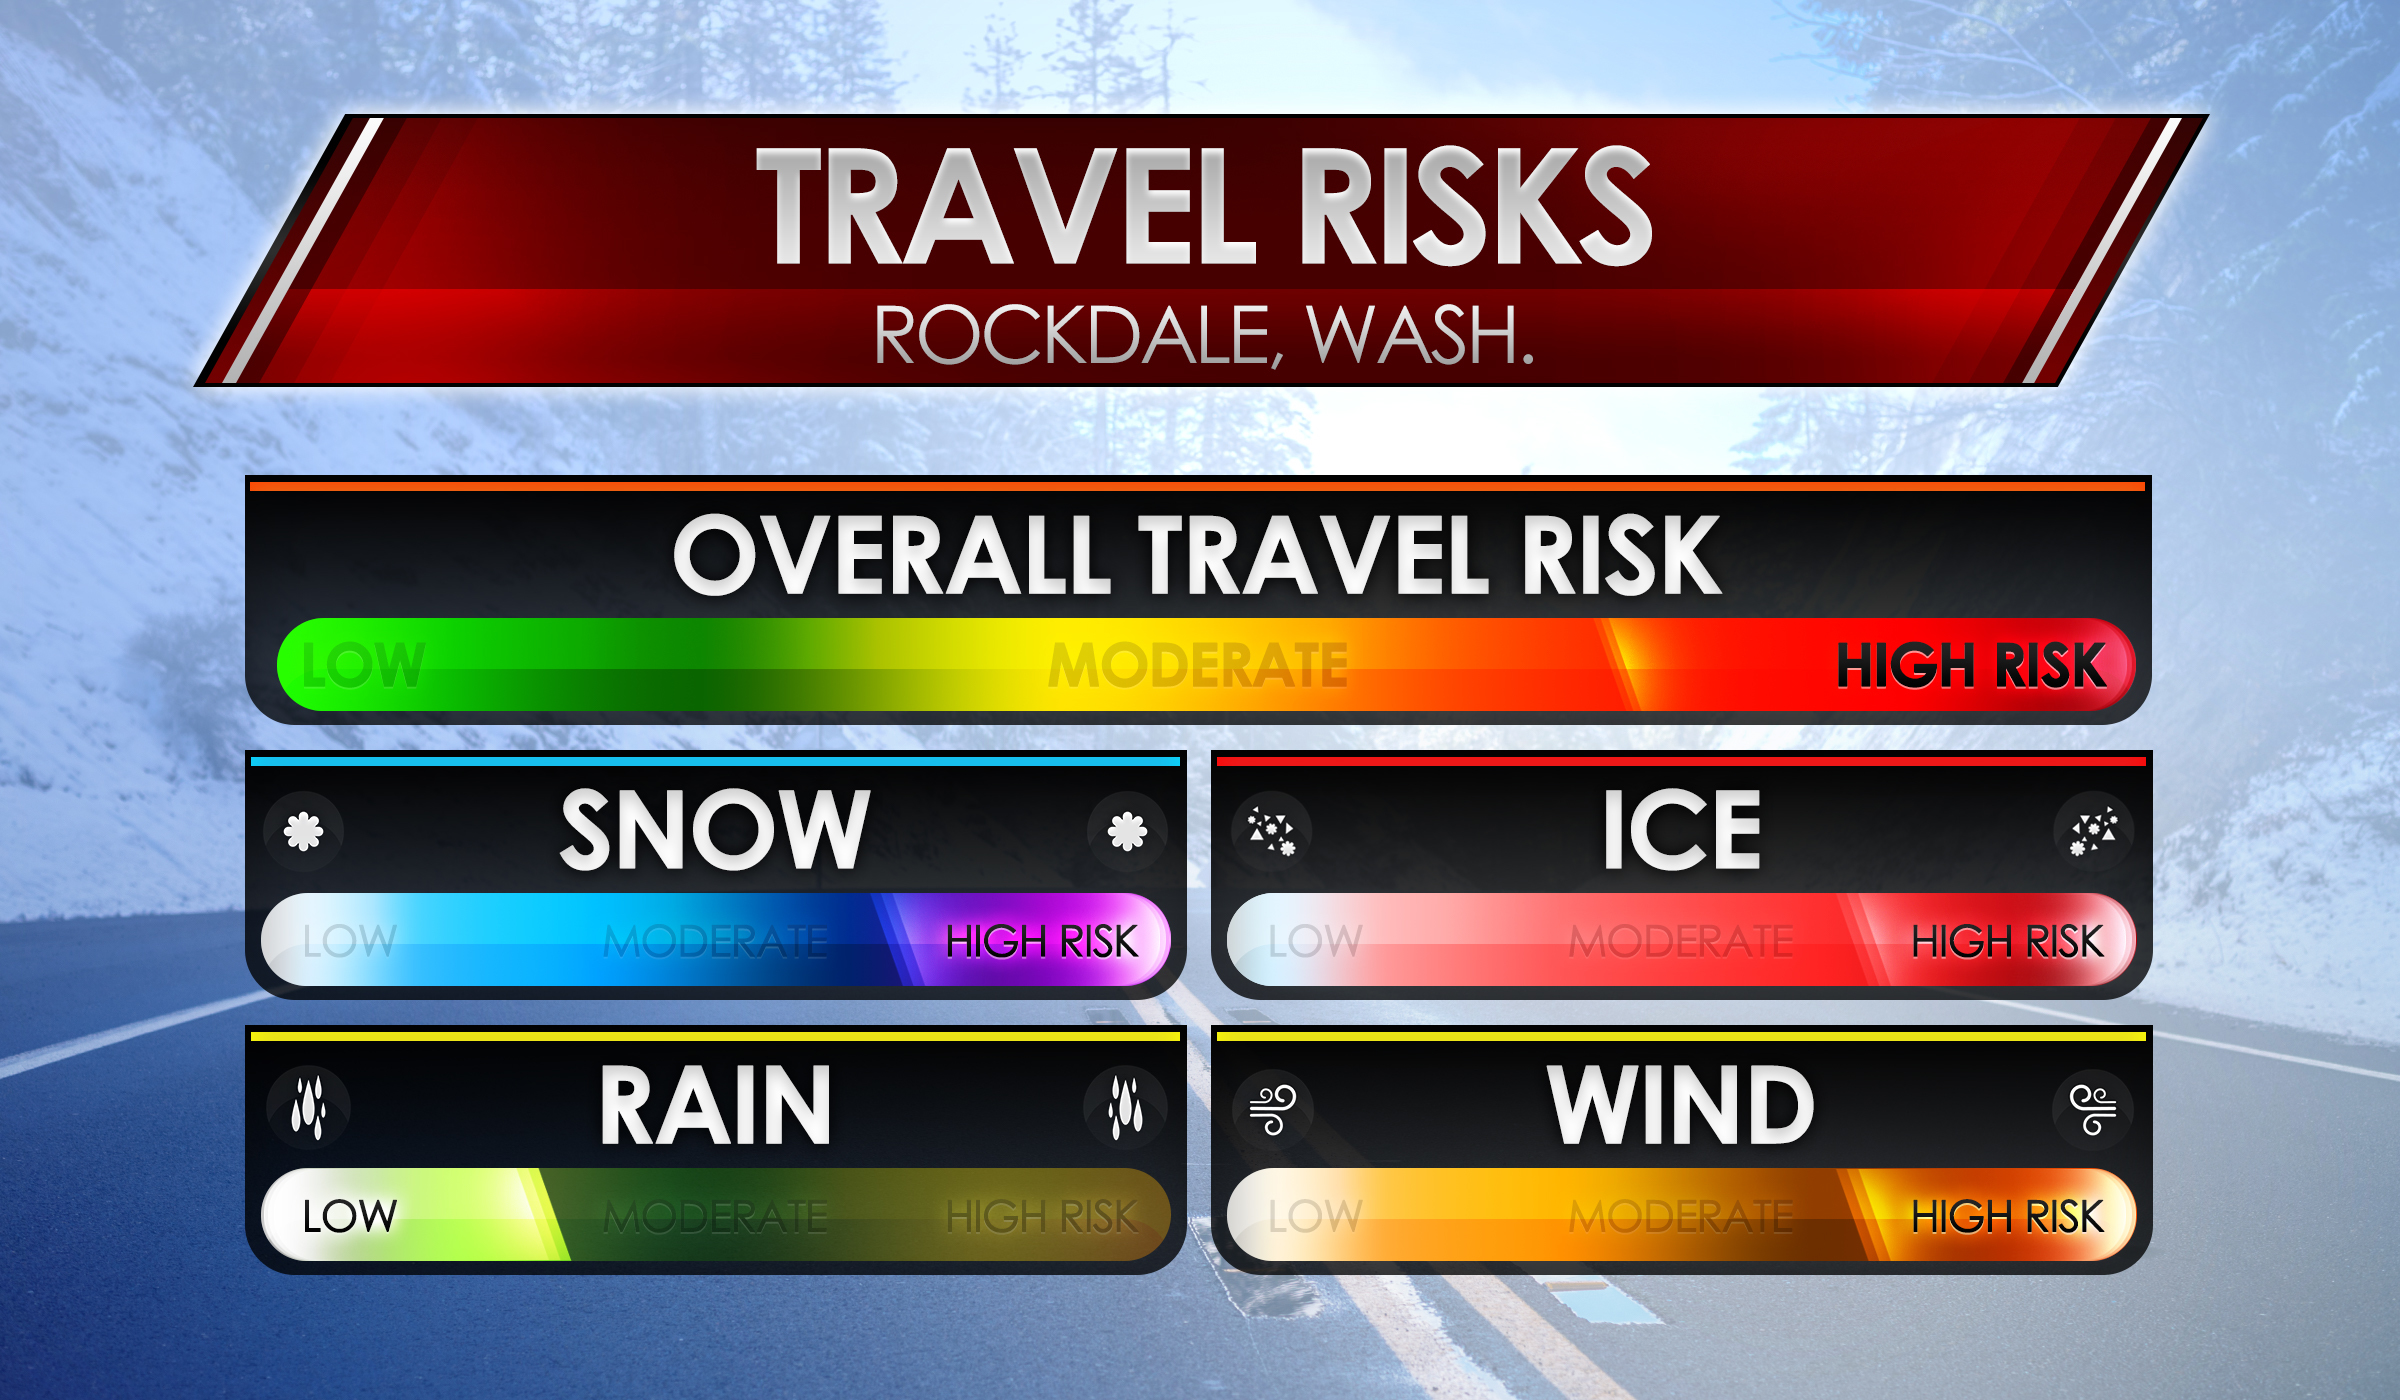
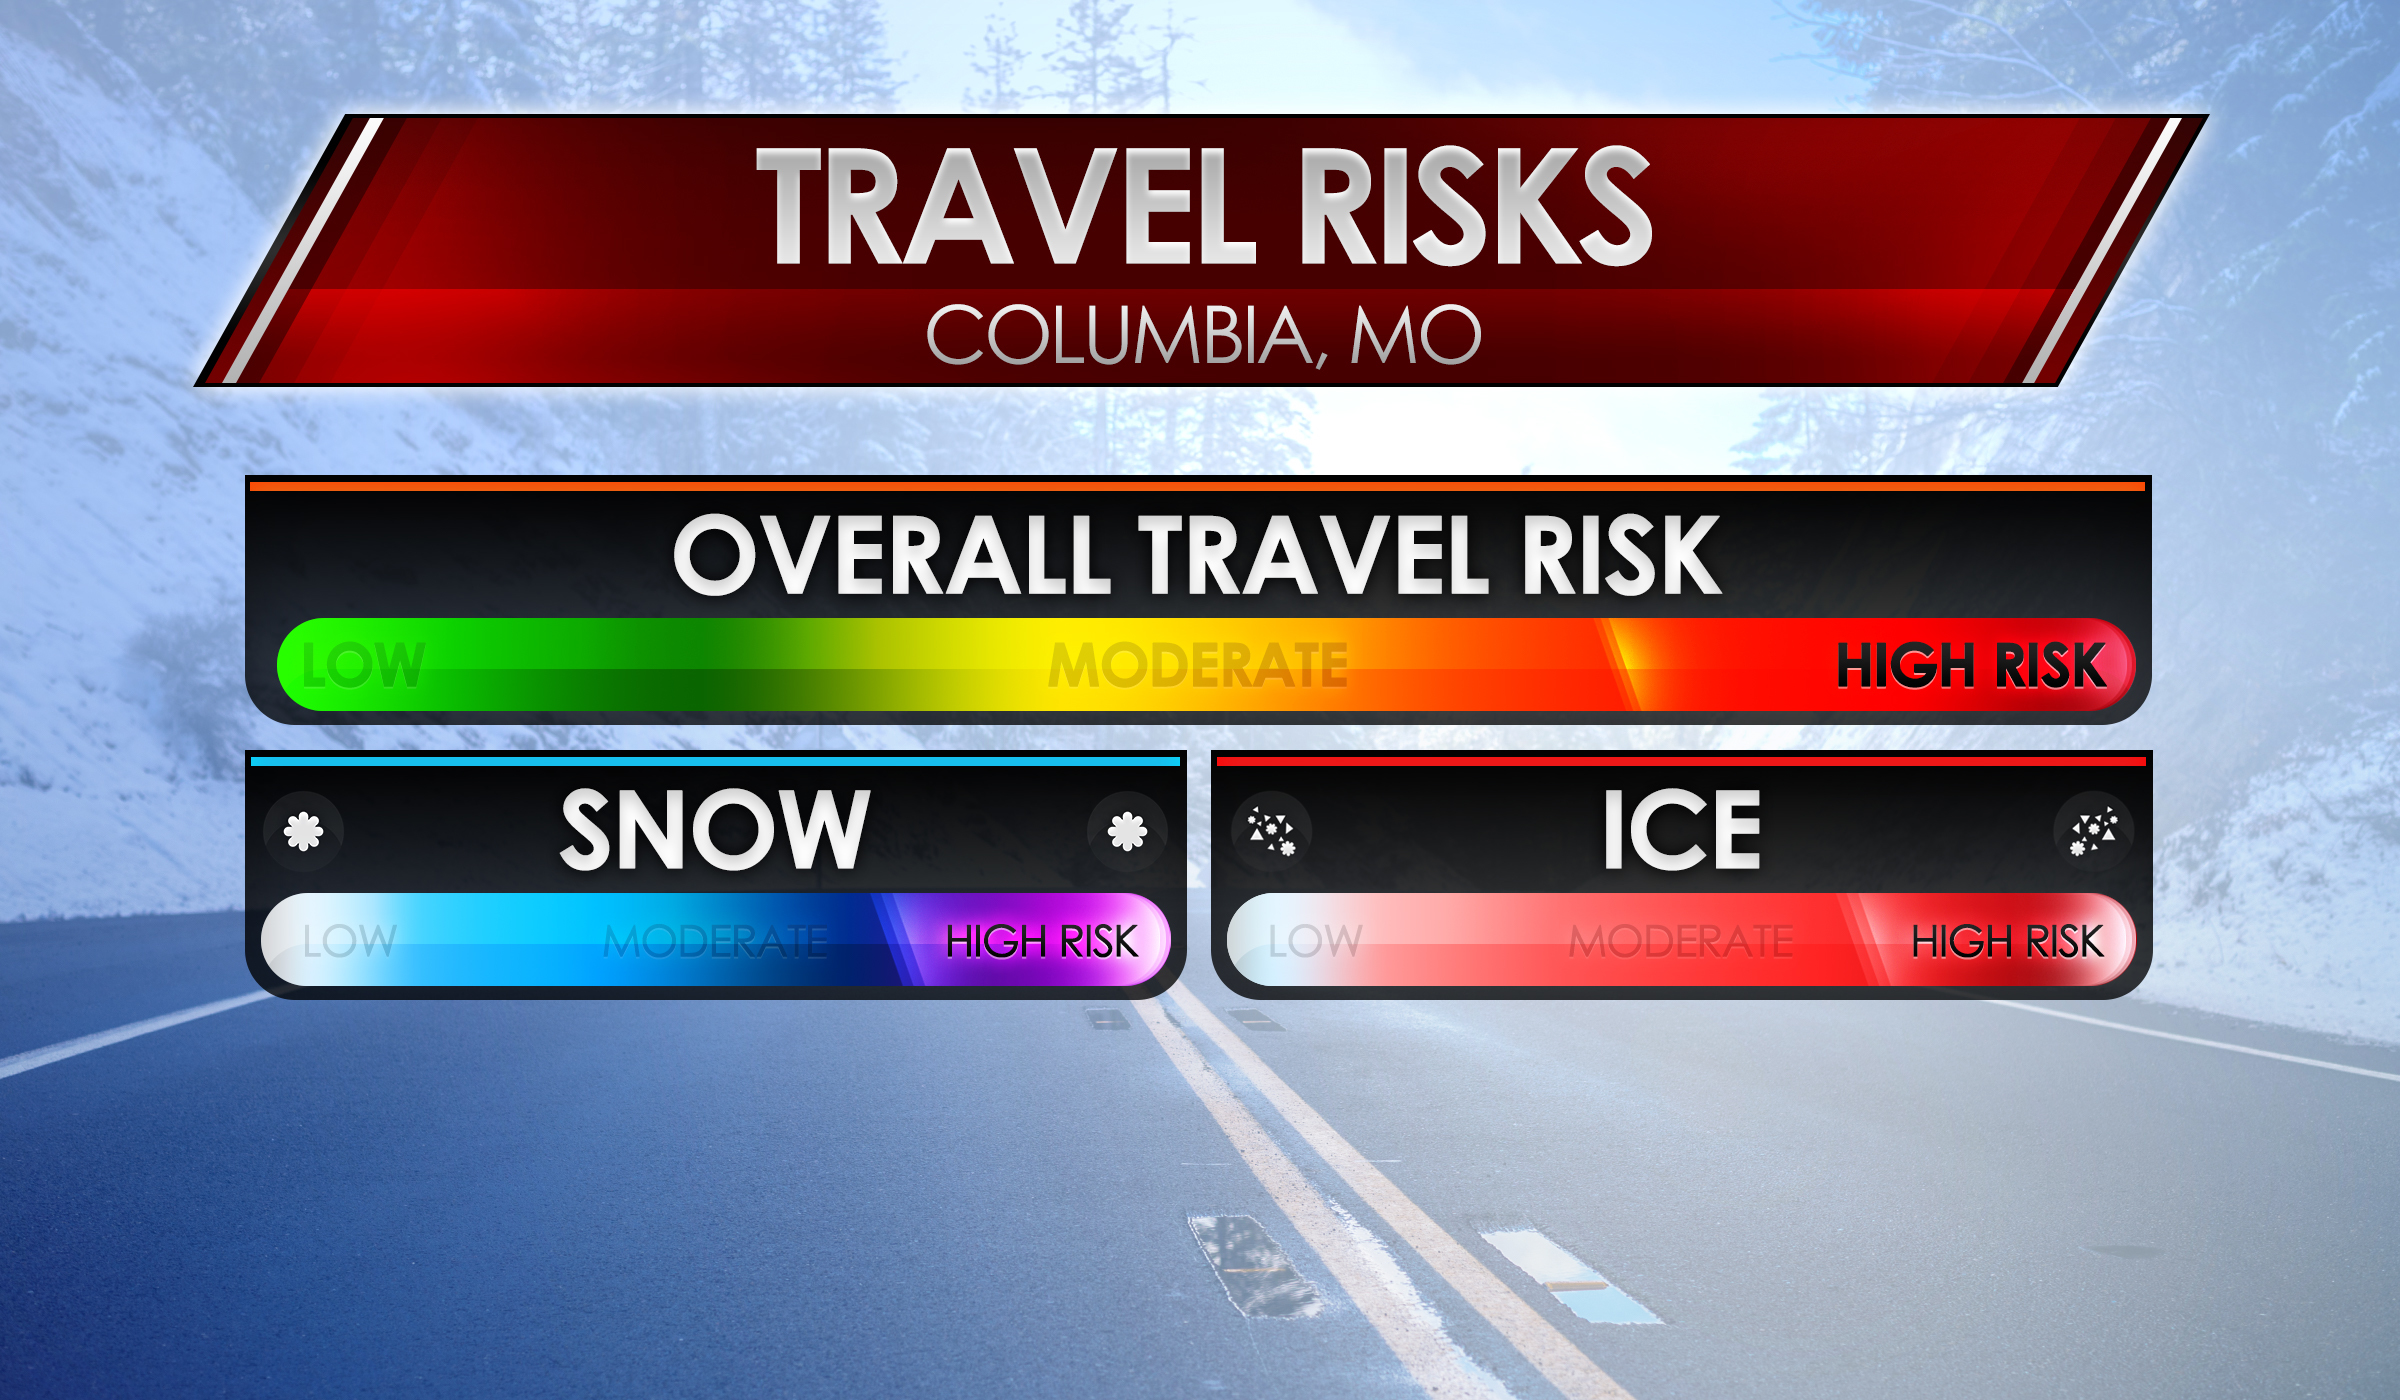
Weather impacts all varieties of travel, whether it’s rain, snow, ice, or even wind. Those impacts could also be quite different from one-another, so it’s only logical to see them all as separate or even non-existent tabs if you were to create a travel risk display for viewers.With the Travel Risk graphic, you as the forecaster can decide which category to show, which to perhaps not, and which are high-risk for travelers. Each weather-specific category has icons to match the theme and three levels of impact: low, moderate, and high — each of which toggle-able.The overall travel risk also includes three levels of impact, same as mentioned above for the weather categories.Included in this pack are PNGs of each bar for each level, totaling to 15 PNGs. Additionally, 2 background options are included along with the upper third. The Photoshop document included is organized for easy toggling should you own Photoshop.The resolution of this design is 2400 x 1400 pixels @ 300 DPI.Parts of this design came from suggestions from a post on the MetGraphics Facebook, where you too can submit input and ideas to be acted on here.





Reviews
There are no reviews yet.